Waiting for go1.21: Execution Tracing with < 1% Overhead
Go’s execution tracer (aka go tool trace) has suffered from high overhead since its inception in 2014. Historically this has forced potential users to worry about up to 20% of CPU overhead when turning it on. Due to this, it's mostly been used in test environments or tricky situations rather than gaining adoption as a continuous profiling signal in production.
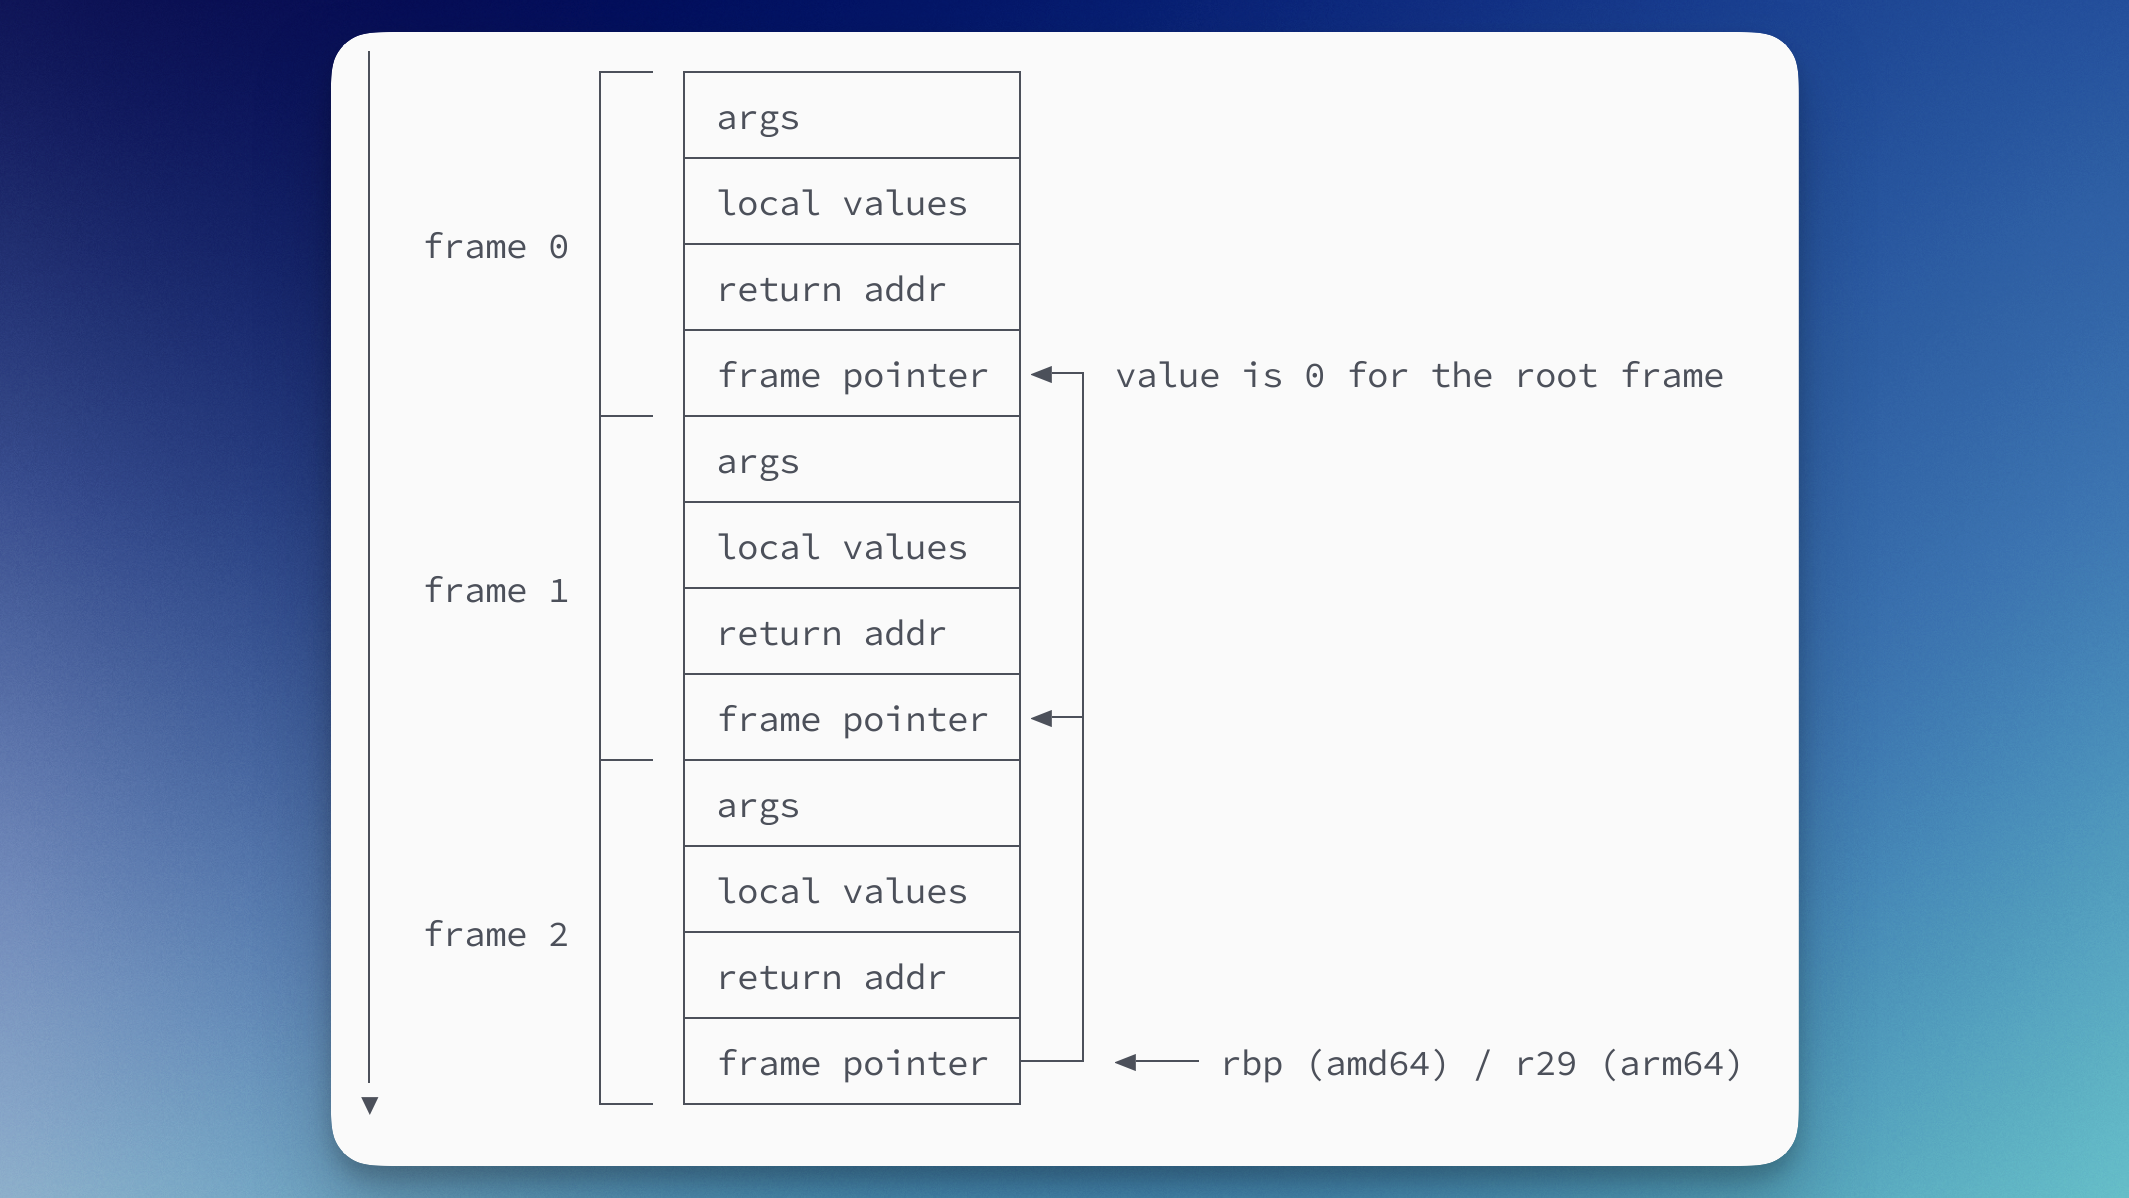
However, in early 2023 my colleague Nick Ripley and I started to become convinced that we could change this by implementing frame pointer unwinding. You can read more about the details in the blog post below:
Since then we’ve been actively collaborating with the Go runtime team at Google, in particular Michael Knyszek, Michael Pratt and Cherry Mui in order to make this a reality. And at this point it looks like we’ve succeeded: The go1.21 release coming out in ~August will feature a new version of the tracer which should provide less than 1% overhead for most applications 🥳 (see upcoming release notes).
Below is a list of directly or indirectly related patches that contributed to this effort:
- 2023-03-13 runtime: remove NOFRAME from asmcgocall, systemstack and mcall (Quim Muntal)
- 2023-03-30 runtime: fix frame pointer loop on amd64 (Felix Geisendörfer)
- 2023-03-30 runtime/trace: enable frame pointer unwinding on amd64 (Felix Geisendörfer)
- 2023-03-30 runtime/trace: use regular unwinding for cgo callbacks (Felix Geisendörfer)
- 2023-03-30 runtime: add a benchmark of FPCallers (Felix Geisendörfer)
- 2023-04-04 runtime/trace: Fix TestTraceSymbolize on solaris and illumos (Felix Geisendörfer)
- 2023-04-05 runtime: save frame pointer to the stack in signal handlers for arm64 (Nick Ripley)
- 2023-04-19 runtime: adjust frame pointer on stack copy on ARM64 (Cherry Mui)
- 2023-04-20 runtime: turn frame pointer unwinding for tracing off by default (Nick Ripley)
- 2023-04-28 runtime/trace: avoid frame pointer unwinding for events during cgocallbackg (Nick Ripley)
- 2023-04-30 runtime: fix systemstack frame pointer adjustment (Felix Geisendörfer)
- 2023-05-02 runtime/trace: enable frame pointer unwinding by default for amd64 and arm64 (Nick Ripley)
- 2023-05-03 runtime: add test for systemstack frame pointer adjustment (Felix Geisendörfer)
- 2023-05-03 runtime: remove systemstack logic from adjustframe (Felix Geisendörfer)
- 2023-05-12 runtime: remove unused skip arg from fpTracebackPCs (Felix Geisendörfer)
- 2023-05-22 runtime: rename getcallerfp to getfp (Felix Geisendörfer)
So if you're into Go performance and observability, this improvement is definitely something to look forward to.
And this is just the beginning:
- Michael Knyszek has proposed a lot of exciting improvements that will further improve execution tracing in upcoming releases.
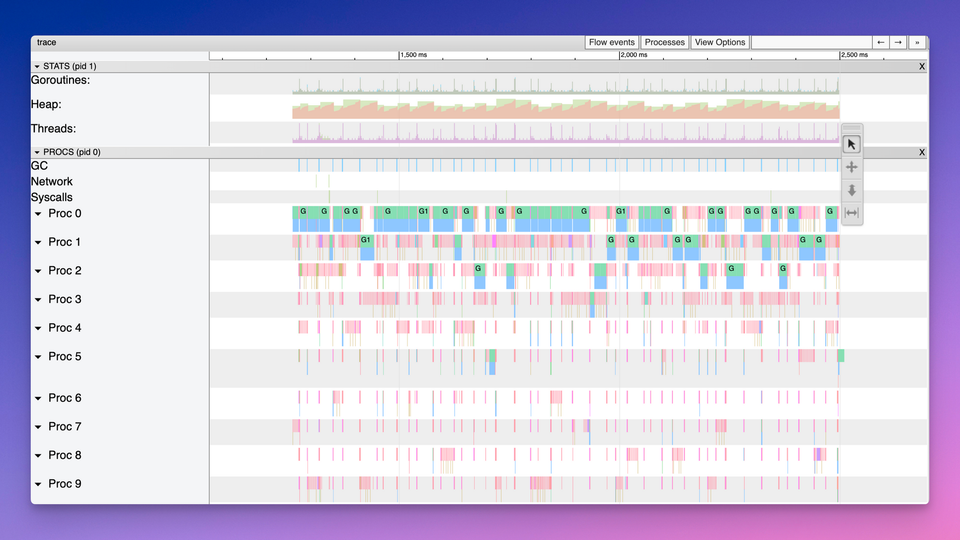
- Dominik Honnef's gotraceui viewer keeps improving.
- We've also been busy with integrating the execution tracer into our profiling product at Datadog. We'll share more information about this soon.
Member discussion